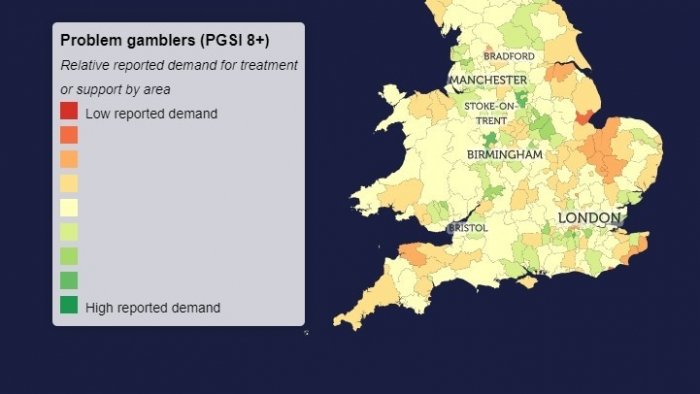
T
he maps indicate that certain areas have a higher take up of gambling treatment and support, whilst others indicate a greater reported demand for or awareness of services.
The charity’s annual GB treatment and support survey produced a nationally representative overview of reported demand and usage of treatment and support, as well as an estimate of the prevalence of gambling harms. This survey outlined differences in gambling participation, usage and reported demand for treatment and support, broken down by area. Based on this research, GambleAware has produced interactive maps to assist in understanding these geographical differences, and to help inform responses by local authorities and wards.
The interactive maps indicate where certain areas have a higher take up of gambling treatment and support, as well as where there is a greater reported demand for, or awareness of, these services. It is key to note that existing efforts to address gambling harms may influence levels of treatment and support uptake, as well as that the maps are based on a single set of data and cannot provide an exact result. GambleAware recommends that local authorities use the maps in conjunction with local data and information relevant to gambling harms.
In areas where there is a reportedly higher reported demand for gambling treatment or support, GambleAware encourages local authorities to do more to promote the existing help available through the National Gambling Treatment Service.
Alison Clare, Research, Information and Knowledge Director at GambleAware, said: “We want to assist local authorities and services in delivering the best possible treatment and support for gambling harms in their area. These new interactive maps can be used to identify shortfalls between treatment and support services and prevalence of gambling participation and harms, which can be used to inform local responses. The existing support available through the National Gambling Treatment Service can be used to help address these shortfalls.”


